Fibonacci Theory
The Fibonacci retracements pattern can be useful for swing traders to identify reversals on a stock chart. On this page we will look at the Fibonacci sequence and show some examples of how you can identify this pattern.
Fibonacci numbers were developed by Leonardo Fibonacci and it is simply a series of numbers that when you add the previous two numbers you come up with the next number in the sequence. Here is an example:
1, 2, 3, 5, 8, 13, 21, 34, 55
See how when you add 1 and 2 you get 3? Now add 2 and 3 and you get 5, and so on. So how does this sequence help you as a swing trader?
Well, the relationship between these numbers is what gives us the common Fibonacci retracements pattern in technical analysis.
Fibonacci Retracements Pattern
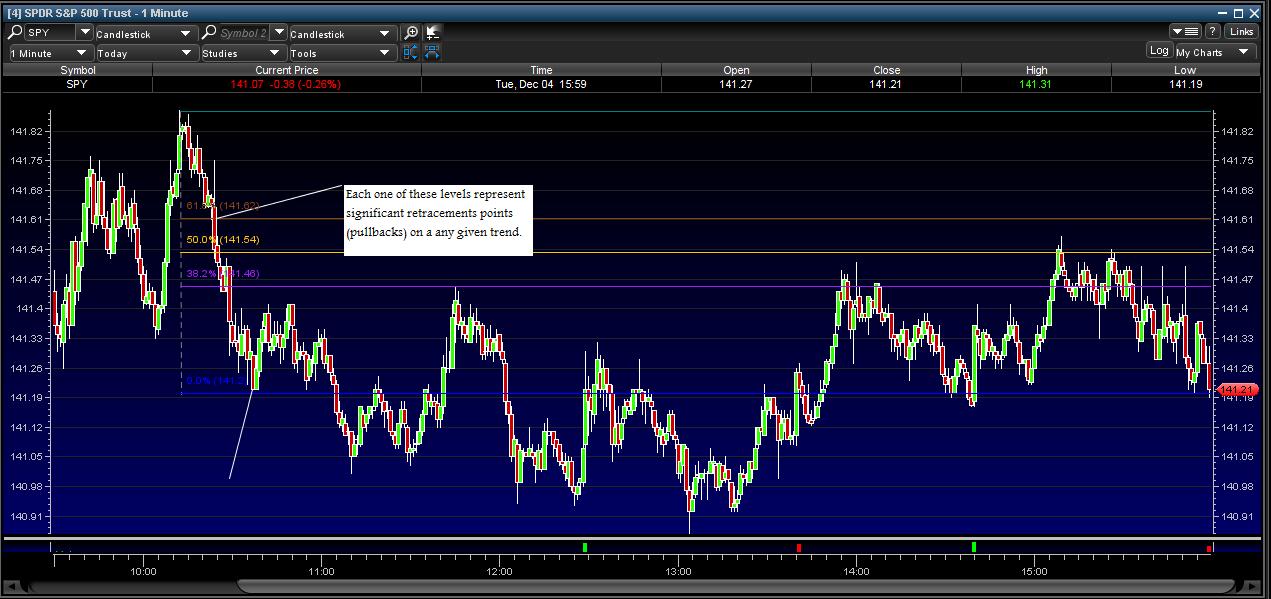
Stocks will often pull back or retrace a percentage of the previous move before reversing. These Fibonacci retracements often occur at three levels: 38.2%, 50%, and 61.8%. Actually, the 50% level really does not have anything to do with Fibonacci, but traders use this level because of the tendency of stocks to reverse after retracing half of the previous move. Here is an example using a graphic explaining the retracement pattern:
This picture shows a graphical representation of the reversal points for stocks in an uptrend. The pattern is reversed for stocks that are in down trends.
After a stock makes a move to the upside (A), it can then retrace a part of that move (B), before moving on again in the desired direction (C). These retracements or pullbacks are what you as a swing trader want to watch for when initiating long or short positions.
Once the stock begins to pull back (retrace), then you can plot these retracement levels on a chart to look for signs of a reversal. You do not automatically buy the stock just because it is at a common retracement level! Wait, and look for candlestick patterns to develop at the 38.2% area. If you do not see any signs of a reversal, then it may go down to the 50% area. Look for a reversal there. You do not know if or when the stock will reverse at a Fibonacci level! You just mark these areas on a chart and wait for signal to go long or short.
How To Draw A Fib Grid
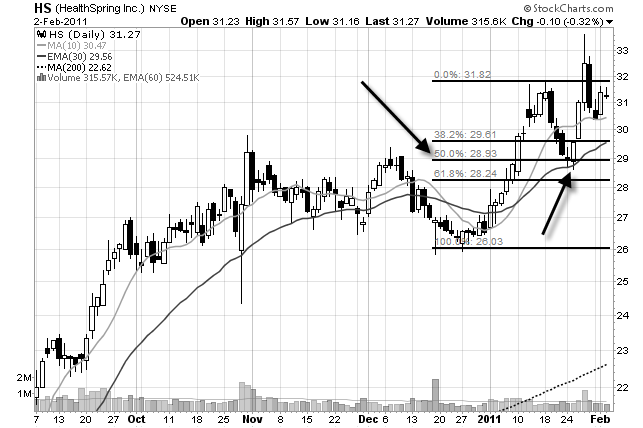
So how do we identify Fibonacci patterns on a chart. Easy, we draw a Fibonacci grid (fib grid) using swing points. Here is an example:
Draw the fib grid from the swing point high and the swing point low of a swing. Your charting software should come with this feature. It is a standard option on most charting packages. If not, you can calculate it manually by using this formula:
Calculate the range from the swing point high to the swing point low.
Now multiply the range times a Fibonacci ratio: 38.2% (0.382), 50% (0.500), and 61.8% (0.618).
Finally, subtract that number from the swing point high. That will give you your Fibonacci levels.
This chart shows an actual trade that I made. HS pulled back into the TAZ and then formed a bullish engulfing candle right at the 50% level. That gave me the signal to go long. Nice trade!


