Moving Averages
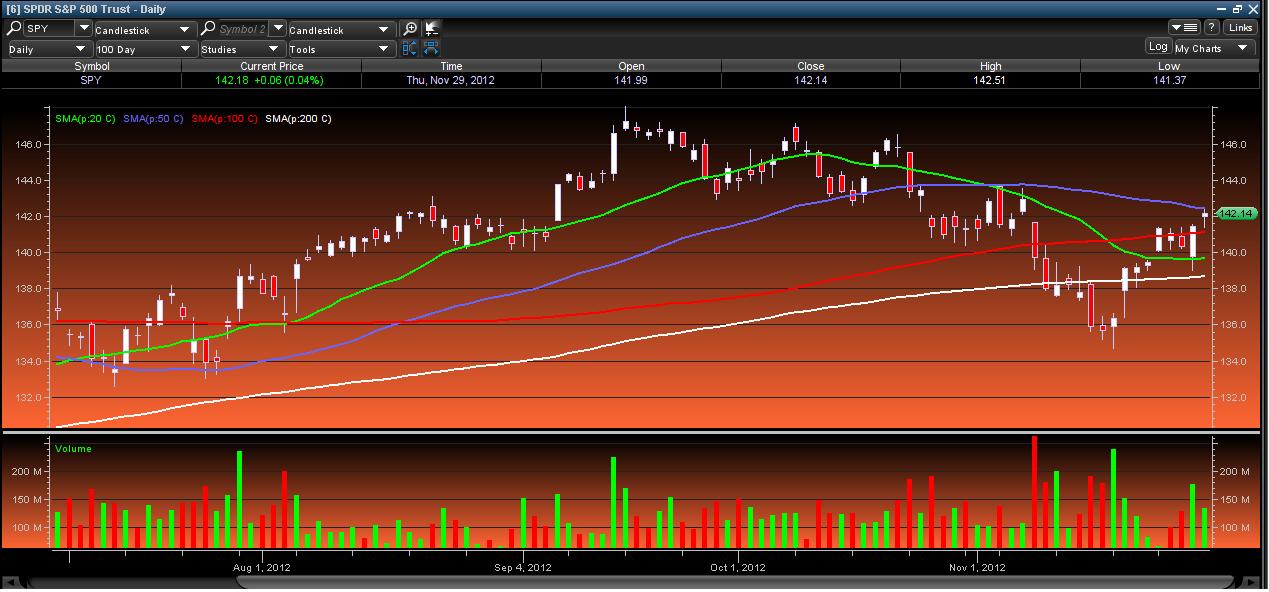
To put it bluntly: If the stock is below a colored line, it goes down. When the stock is above the line, it goes up. You buy your stock when it is above that line and when it is as close to it as possible. That way, you can put your stop-loss right below the line to minimize your downside risk.
Some of the primary functions of a moving average are to identify trends and reversals, measure the strength of an asset’s momentum and determine potential areas where an asset will find support or resistance. In this section we will point out how different time periods can monitor momentum and how moving averages can be beneficial in setting stop-losses. Furthermore, we will address some of the capabilities and limitations of moving averages that one should consider when using them as part of a trading routine.
Support
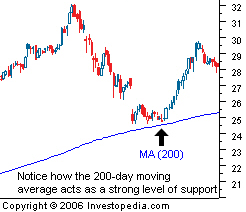
Another common use of moving averages is in determining potential price supports. It does not take much experience in dealing with moving averages to notice that the falling price of an asset will often stop and reverse direction at the same level as an important average. For example, in Figure 3 you can see that the 200-day moving average was able to prop up the price of the stock after it fell from its high near $32. Many traders will anticipate a bounce off of major moving averages and will use other technical indicators as confirmation of the expected move.
 |
Resistance
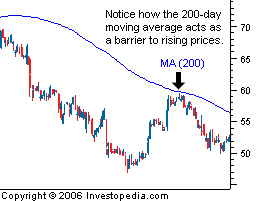
Once the price of an asset falls below an influential level of support, such as the 200-day moving average, it is not uncommon to see the average act as a strong barrier that prevents investors from pushing the price back above that average. As you can see from the chart below, this resistance is often used by traders as a sign to take profits or to close out any existing long positions. Many short sellers will also use these averages as entry points because the price often bounces off the resistance and continues its move lower. If you are an investor who is holding a long position in an asset that is trading below major moving averages, it may be in your best interest to watch these levels closely because they can greatly affect the value of your investment.
 |
Stop-Losses
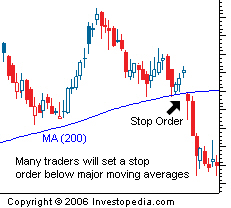
The support and resistance characteristics of moving averages make them a great tool for managing risk. The ability of moving averages to identify strategic places to set stop-loss orders allows traders to cut off losing positions before they can grow any larger. As you can see in Figure 5, traders who hold a long position in a stock and set their stop-loss orders below influential averages can save themselves a lot of money. Using moving averages to set stop-loss orders is key to any successful trading strategy.
 |
Strategies
Different investors use moving averages for different reasons. Some use them as their primary analytical tool, while others simply use them as a confidence builder to back up their investment decisions. In this section, we’ll present a few different types of strategies – incorporating them into your trading style is up to you!
Crossovers
A crossover is the most basic type of signal and is favored among many traders because it removes all emotion. The most basic type of crossover is when the price of an asset moves from one side of a moving average and closes on the other. Price crossovers are used by traders to identify shifts in momentum and can be used as a basic entry or exit strategy. As you can see in Figure 1, a cross below a moving average can signal the beginning of a downtrend and would likely be used by traders as a signal to close out any existing long positions. Conversely, a close above a moving average from below may suggest the beginning of a new uptrend.
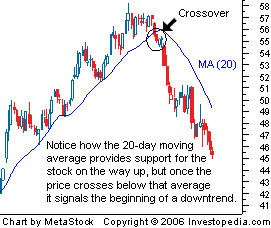 |
The second type of crossover occurs when a short-term average crosses through a long-term average. This signal is used by traders to identify that momentum is shifting in one direction and that a strong move is likely approaching. A buy signal is generated when the short-term average crosses above the long-term average, while a sell signal is triggered by a short-term average crossing below a long-term average. As you can see from the chart below, this signal is very objective, which is why it’s so popular.
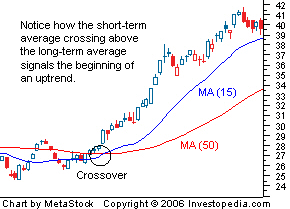 |
Filters
A filter is any technique used in technical analysis to increase one’s confidence about a certain trade. For example, many investors may choose to wait until a security crosses above a moving average and is at least 10% above the average before placing an order. This is an attempt to make sure the crossover is valid and to reduce the number of false signals. The downside about relying on filters too much is that some of the gain is given up and it could lead to feeling like you’ve “missed the boat”. These negative feelings will decrease over time as you constantly adjust the criteria used for your filter. There are no set rules or things to look out for when filtering; it’s simply an additional tool that will allow you to invest with confidence.
Moving Average Envelope
Another strategy that incorporates the use of moving averages is known as an envelope. This strategy involves plotting two bands around a moving average, staggered by a specific percentage rate. For example, in the chart below, a 5% envelope is placed around a 25-day moving average. Traders will watch these bands to see if they act as strong areas of support or resistance. Notice how the move often reverses direction after approaching one of the levels. A price move beyond the band can signal a period of exhaustion, and traders will watch for a reversal toward the center average.
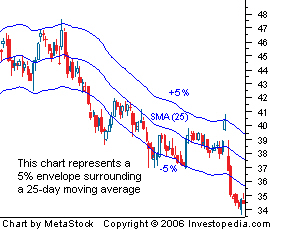 |
Stock moving averages tell you when to buy and when to sell. WSSS.com teaches you how to buy stocks according to where they are relative to their moving averages. Moving averages are sometimes the only indicator of a stocks valuation. No matter how good the stock is, if it is not cooperating with the moving averages, it is a no buy.


