
Thank God for dividends! They are the only free lunch you can get in this market. Income-based investing has certainly been the saving grace for the portfolio in 2022. Not only have the dividends received from a number of our 4-5 star holdings kept the lights on and bills paid in our personal lives, but they have also managed to help the portfolio outperform the S&P 500 and Nasdaq benchmarks, handily, in the process.
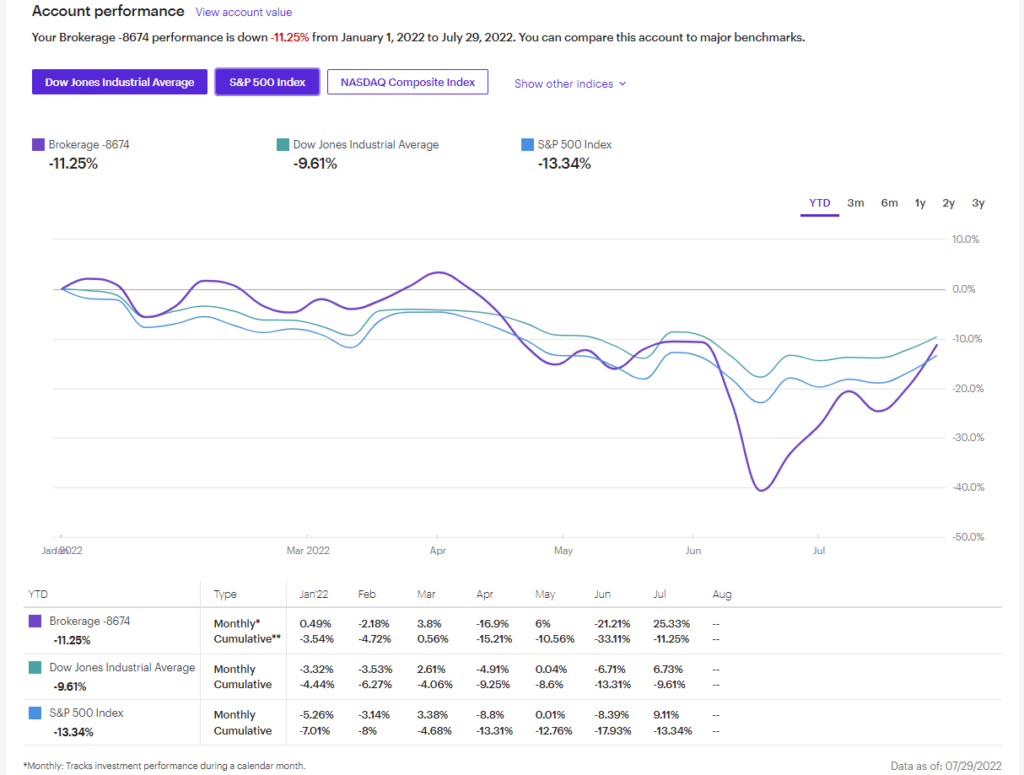
Let’s be clear, it was not dividends alone that contributed to the outperformance. A fair bit of market timing using charts was required, as well as having a firm conviction in my thesis; the thesis being: every 10% dip in the market must be bought, even if the consensus thinks otherwise. Heck, especially since the consensus thinks otherwise; because the market has averaged a 7% gain per year since its inception.
Bullish Factors to Seriously Consider:
Market sentiment indicators, for example, have been at extreme bearishness levels. So, I have been piling into my positions as a result. Other important data points to consider when formulating our thesis are as follows:
The manufacturing index came in today at 52.8, above expectations of 52.1. But, anything over 50 signals expansion in the economy, not contraction… So, if the original est. was for +50, how could so many people fear a recession? The Federal Reserve is saying we are not in recession, and you NEVER fight the Fed; an old adage that has stood the test of time.
High unemployment? Negative. Best job market in decades. Earnings crashing? Negative. Corporate profits continue to beat on top and bottom lines.
The Devil is in the Details…
The only companies that are missing estimates are companies with poor product mix like Target and Walmart, who are forced to sell high priced discretionary items at a discount because consumers are not spending on large ticket items anymore due to high inflation. Companies with supply chain issues are also missing, but these headwinds should be resolved soon as onshoring and nationalism continues in the US.
Even this bad news of poor product mix is good news, because it is disinflationary when prices come down; this argument becomes just another nail in the coffin for the inflation bears.
Consumers are also going towards services more as the reopening theme continues; meaning that, even as profits fall at retailers who sell big ticket items, money is flowing to other parts of the economy, keeping GDP intact at heathy levels. Where’s the fire?
What about high energy prices? No. Already baked into estimates, and commodity prices have fallen significantly from recent highs. Housing prices have come down. Cramer phrased it best on CNBC’s Squawk Box recently, “don’t go on Zillow and check your house prices, you’ll throw up.”
This is Not The Dotcom Bubble
Hypergrowth got decimated. Bitcoin crashed. Large cap tech has pulled back in grand fashion, some holdings within the S&P index being down over 50%. Even a top-weighted company like Amazon wasn’t safe from a shellacking. How many more signs do you need in order to see that excesses have come out of this market?
Some people say that, since the S&P 500 is heavily tech-weighted, that it will continue to fall as tech companies suffer from the reopening and rising rates. But, who stops using Google search engines on their phones when traveling to Europe?
Maybe people cut back in areas like a Pinterest, but no one stops using Google; and who says the FANGs (Facebook, Amazon, Netflix, Google) need lower rates for getting loans and things of that nature? They have fortress-like balance sheets and need no help with funding (well, maybe Netflix could use a little push right now). But you get the picture. This is not the dotcom bubble.
Well, it so happens to be that Google is in the S&P 500 index, not Pinterest. This distinction is key in determining where the bottom is in the market indexes. One has to look at the individual components that comprise the indexes.
Cathie Woods high-flying growth stocks, like Zoom and Pinterest, for example, are not in the indexes. This is how one stays protected during a bear market. Stay out of the momo-growth names and stay in quality growth that is tied to the indexes, and dollar-cost average on the way down.
Better yet, don’t buy the stocks themselves. Buy the index itself; and even better than buying the index, such as the Spyder S&P 500 ETF (SPY), buy similar indexes that offer a monthly dividend to help juice returns and pay your way through life at the same time.
What They Don’t Teach in School
After all, the banks don’t look at gains from the S&P 500, or Cathie Woods Ark funds for that matter, when determining whether or not to provide a loan to you for a house or car. No.
You need qualifying income for that (kind of like a synthetic paystub), which is what dividends provide WHILE still managing to appreciate in price along the way; best of both worlds I say. Share price gains AND dividends. What’s not to like?
Look, banks won’t take stock gains for a housing loan, I tried. They want reliable income for two years straight in order to qualify.
So, the world opens up to you in the form of loans when you make the conversion to this new religion, or way of life, that denounces flashy gains and FOMO in growth stocks. It, instead, embraces the quiet, slow and steady way of investing, which truly wins the race; and it allows you to finance the things you really want in life.
The Magic of Conservative Leverage
But, nothing is slow for our portfolio, since we use leverage to amplify our returns. We do so in a safe manner, we believe, because we are using the leverage on steady dividend funds that generally move sideways to up, and are inherently less risky and volatile than traditional stocks or indices.
Last week, for example, we saw consecutive gains of approximately $15,000 per day in the portfolio, and I didn’t have to risk the farm to pull-off this incredible feat. Nor did a major snapback bounce need to occur.
No. All I had to do was benchmark my investments to the indexes and use leverage (margin) to do the rest of the leg work. Last month in May (see below), the portfolio saw a gain of over $50,000 in just one day. So, the daily returns in these conservative names can still be quite explosive, needless to say.

Game Plan Moving Forward:
The S&P 500 is up against major resistance of the 100-day moving average (blue line). The RSI is also flashing nearly overbought signals at around 70. But, these bearish indicators don’t deter me.
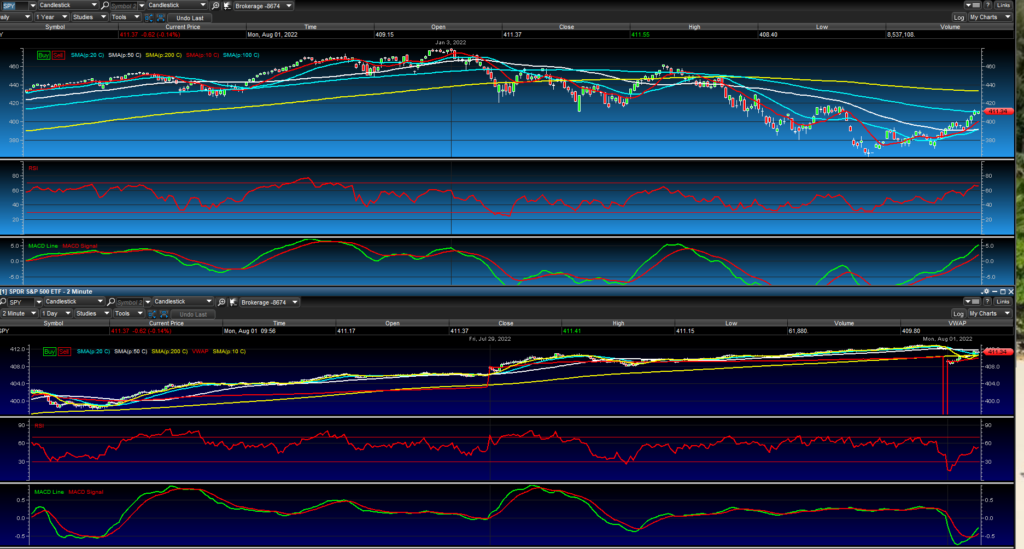
First of all, the bottom is most likely in. Indexes fell nearly 30% in a time period that some are calling the roaring 20’s again, as new technology and competitive advantages for fortune 500 companies emerge.
There are also numerous other bullish indicators to list, some of which I alluded to above, that confirm my bullish view, such as interest rates still being historically low, growth still being relatively high, analyst estimates being artificially low from the great reset shutdown in 2020, and supply chain issues persisting that still remain yes, transitory in my view (like the Fed said).
Therefore, even though technicals on the charts are flashing short-term bearish signals, I believe any dip should be bought and, ultimately, the market will continue to climb the wall of worry until we reach the final area of resistance at the 200 day moving average (or the yellow line).
It is even reasonable to believe that the market reaches new highs by the end of the year, as the Fed begins easing on interest rates and companies see the benefits of a strong consumer (who increased spending by 1% this quarter, actually, which is another bullish indicator- since GDP is 70% consumer driven).
However, I won’t count my chickens before they hatch. Let’s just focus on buying any further dips until the market does indeed reach the 200 day mavg, in which case we may do a little rebalancing of gains. But we’ll cross that bridge when we get there. Don’t be swayed by the crowd.
Trust the dividend process, trust in capitalism, stay tuned for more updates, and subscribe for inside access to my portfolio.

Update Aug 2, 2022
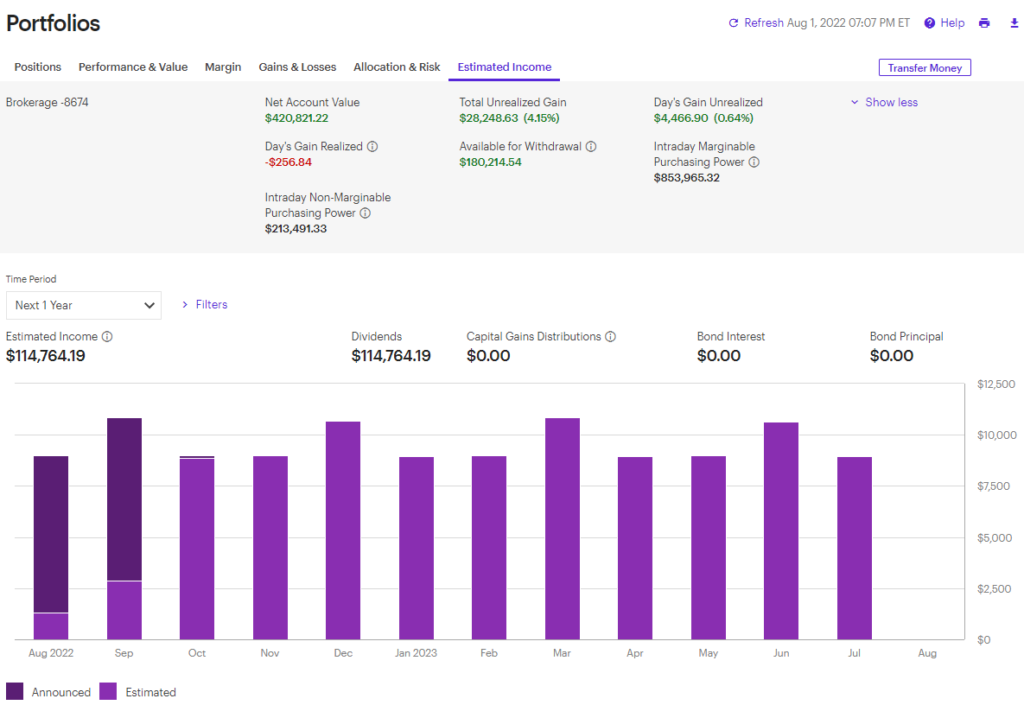
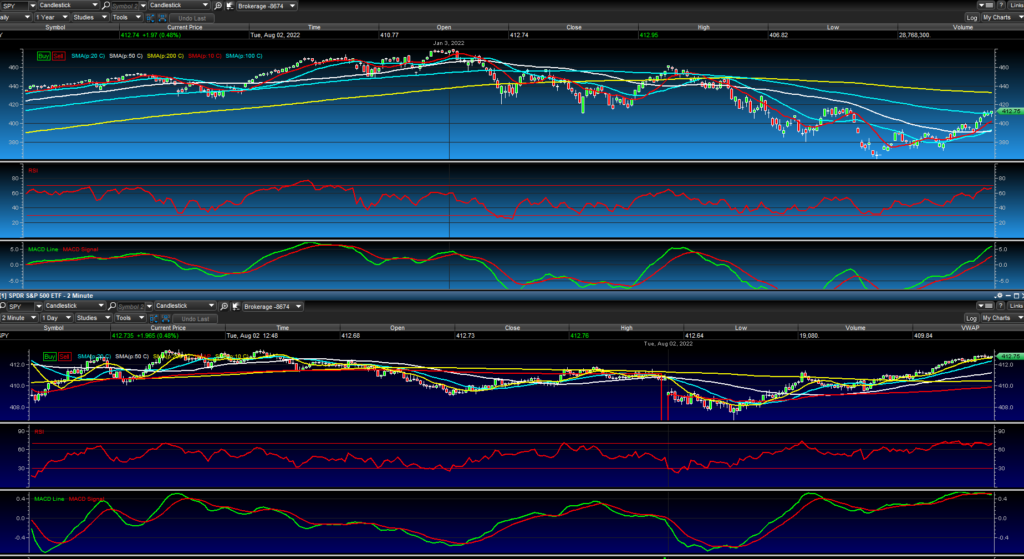
Gameplan continues to work, as any dip in the market is bought up quickly. As seen by the chart below, the market went from red to green in less than an hour and is beginning to make a push past resistance of the 100-day mavg (blue line). A bullish sign for investors.
Subscribe for inside access to my portfolio. Stay tuned for updates!
3:00 P.M.


Update Aug 3, 2022
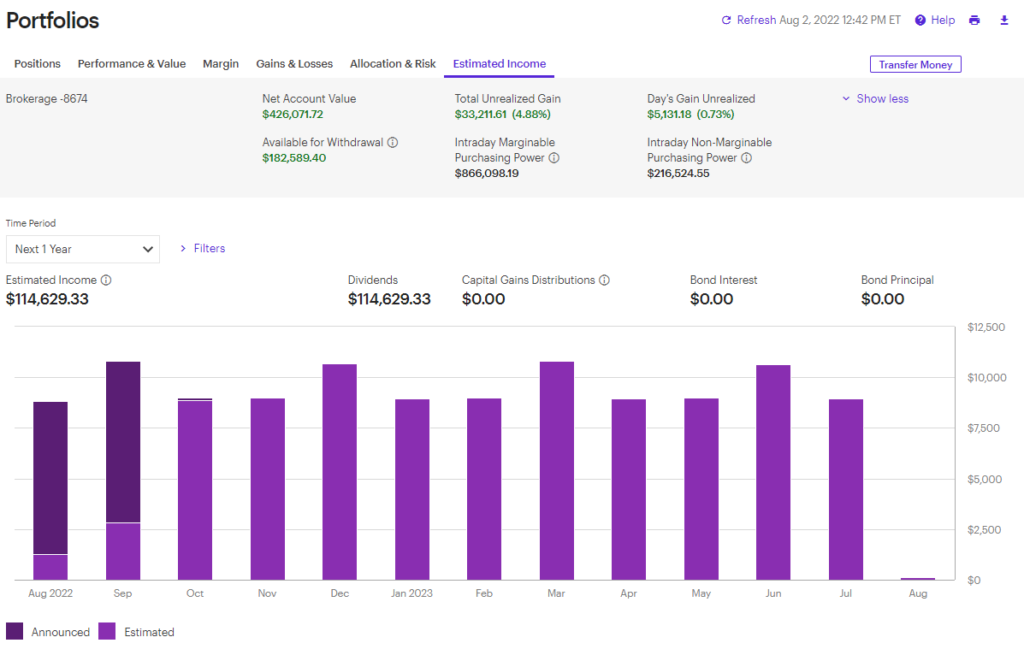
Another day another $5,000 dollars, as seen below. Most peers I know believe that using a dividend approach is boring and slow; but they don’t understand leverage and the brilliance of some income funds out there that provide dividends monthly AND daily gains through their annual rights offerings.
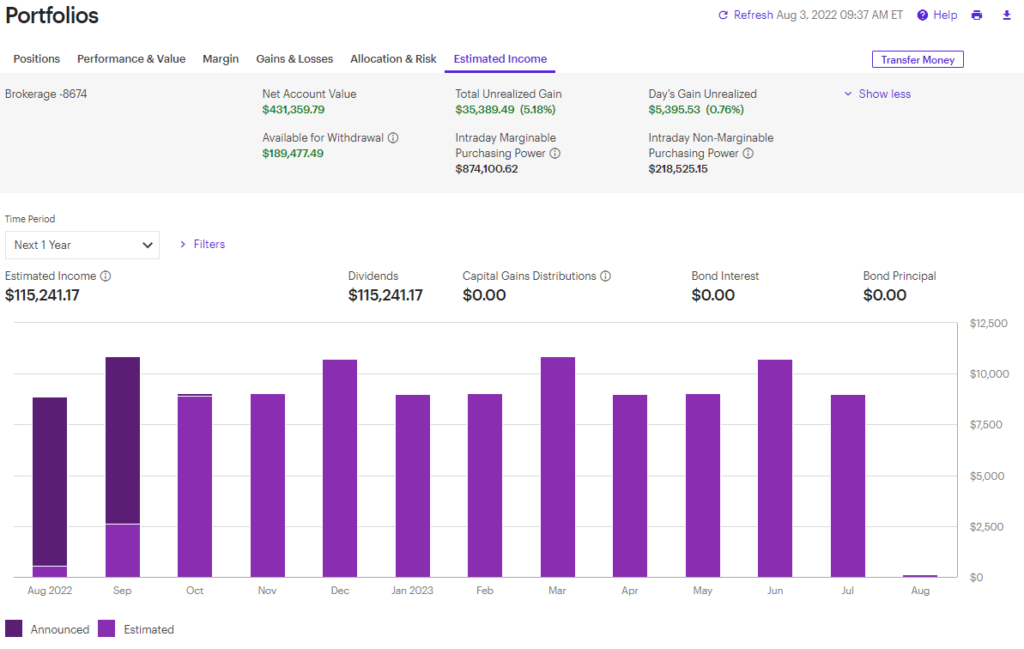
One should look up “rights offerings for closed-end funds” if they’re not familiar with them. They are easy and highly lucrative to participate in. Regardless, another strong open to start the day. However, the market is still at resistance of the 100-day mavg (blue line) as seen below.
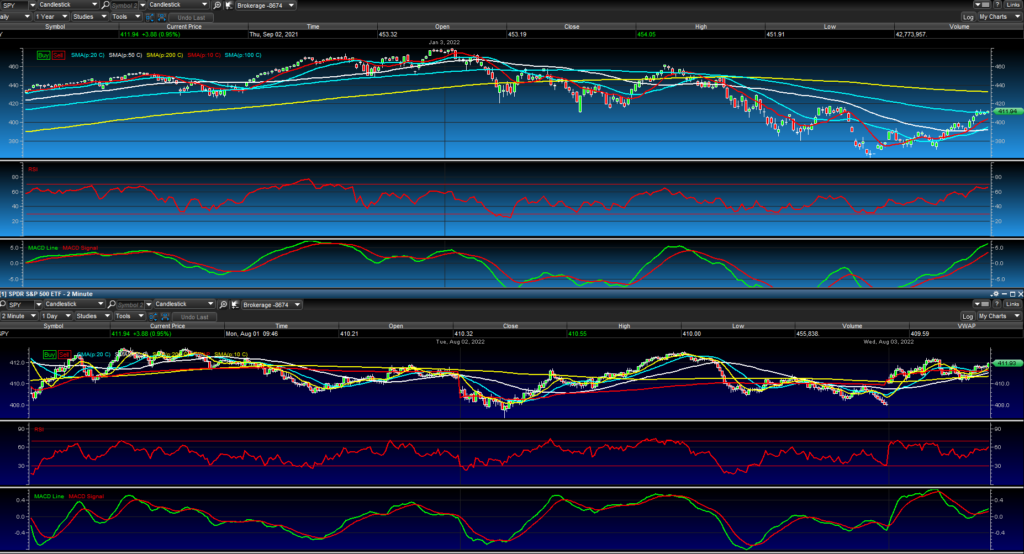
Wait for any dip below the 100 day mavg (blue line) to buy if you are a short-term, nervous trader. Long-term investors should start backing up the truck now and buy, as they may not see these kinds of prices again in their lifetime. Hence the numerous updates on this article.
11 A.M.
Up closer to $10,000 at the moment, as seen below. Some would say to take the gain. But, if you do, you lose your income; so why sell? Whether prices move up or down is not the issue with real estate or dividend funds, since all you are wanting is the monthly income, which eventually pays back the mortgage, or margin (in the case of stock investors), on its own.

1:00 P.M. Market Makes Push Above Key Resistance
The S&P 500 is attempting to break above the 100 day mavg (blue line), which we have been focusing on ad nauseum it seems like at this point. However, it is the signal needed to go long if you are looking to put serious capital to work. The portfolio has rallied further as a result, seen below.

The key for a strong finish is to see the SPY hold the 100, now that it has broken past the all-important mavg to the upside. If this holds, next stop will be the 200 day mavg (yellow line), where you will most certainly see a pause in the move up. This is because the 200 is considered the most significant resistance area of them all.

We have already gotten the golden cross of the 50 day mavg (white line), which passed up through, or “crossed,” the 20 day mavg (turquoise line as seen above). This was a bullish development for both short-term and long-term investors, and they were putting fresh money to work as a result.
But, again, if we hold the breakout of the 100 day mavg that just occurred as I write this update, all systems go for another leg higher in the market. Don’t miss the eye-watering yields in some of these income funds. Stay tuned for more updates! Subscribe for portfolio access.

Update August 4, 2002- ***Taking Profits***
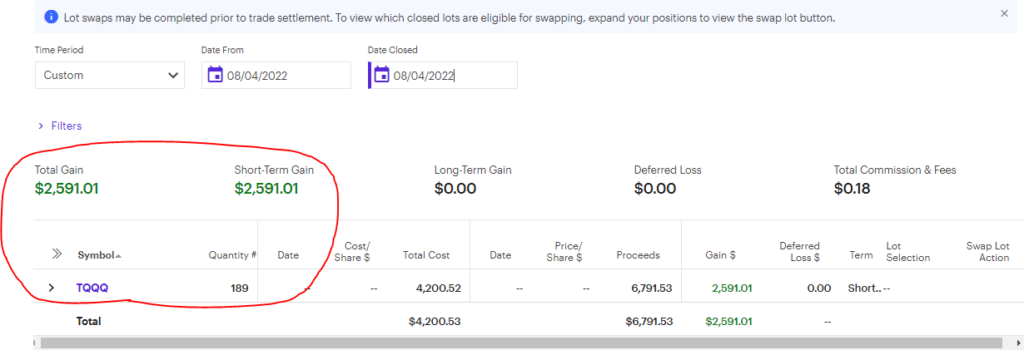
Strong start, once again. But, taking some profit in the TQQQ’s as this run is getting long in the tooth; RSI is starting to show overbought signals. Hey, you never go broke taking a profit. Income still unchanged at over 100K/Yr. as TQQQ has no dividends. Updates to follow! Subscribe for portfolio access.

Update Aug 8, 2022- Market Attempts New Leg Higher


Everything is going according to plan. Updates to follow. Subscribe for portfolio access.
Update Aug 8, 2022- Selling Puts For $4,000 More in Premiums
The market (SPY) continues to push higher, and even though there is much more room to go before hitting resistance of the 200 day mavg (yellow line), or even old highs, I still believe it’s prudent to ring the register as the market is up 10 straight percentage points from the lows.
In other words, the portfolio has clawed back almost $200,000 in two months. So, for us, being prudent and disciplined is key.

By selling puts on the indexes in UPRO and TQQQ (seen above), we were able to eke out another $4,000 in premiums, on top of the $7,000 daily gain. Ringing the register and taking a profit is nice, but selling puts to get extra premium, WHILE REDUCING RISK, is paramount.
So, we reduced risk by selling our outright stock positions in UPRO and TQQQ. But, we also reduced risk even more by lowering our cost basis in those indexes.
For example, our original cost basis in TQQQ was $35. The premiums were fetching $2,000 (or 20 points X 100 shares) at a strike price of $50.00. So, while we went out of the money by 15 points or so, (50-20 = $30.00 per share and, anything out of the money is considered aggressive), we still are lowering our risk substantially in the form of reducing our costs basis five points to $30.00.
In essence, we control the same indexed securities in UPRO and TQQQ but reduced our cost basis by $5 to $30.00 per share- and got paid $4,000 to do so. We also reduced margin by 15k, and the 3% interest it accrues, in the process. Does it get any better than this?


