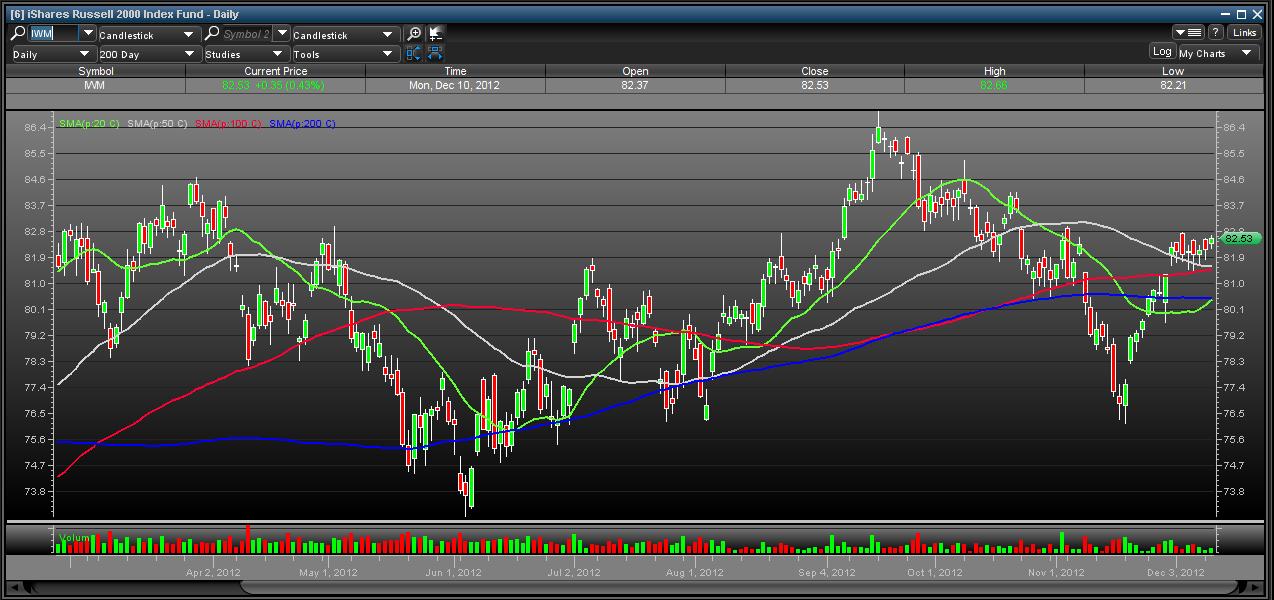
IWM- Russell 2000 Small Cap Index: A significant proxy for the strength of the overall market. If this is index is doing well, it implies that money managers are more inclined to put risk on the table with buying smaller market cap companies. This chart is bullish as it is above all moving averages and therefore is bullish for stocks.

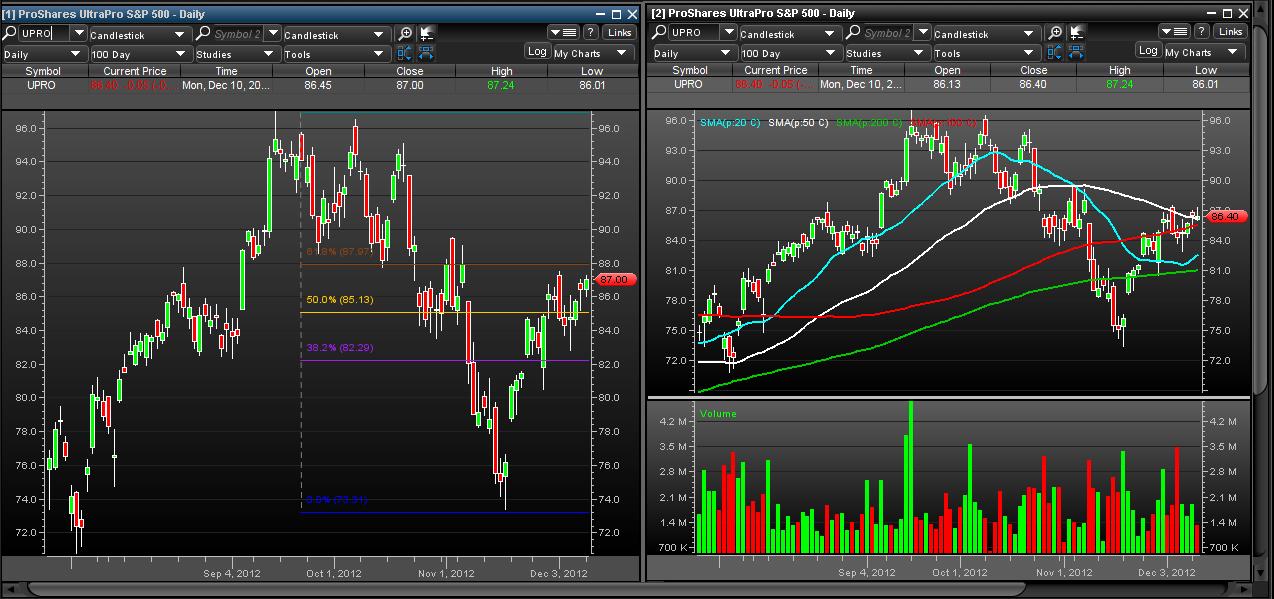
Left: The S&P 500 continues to hold the 50 % Fibonacci Retracement level (Bullish). Right: The S&P 500 has broken past the 50 day moving average and has surpassed all resistance levels (Bullish). Breadth looks good as well- stocks look ready to move higher.

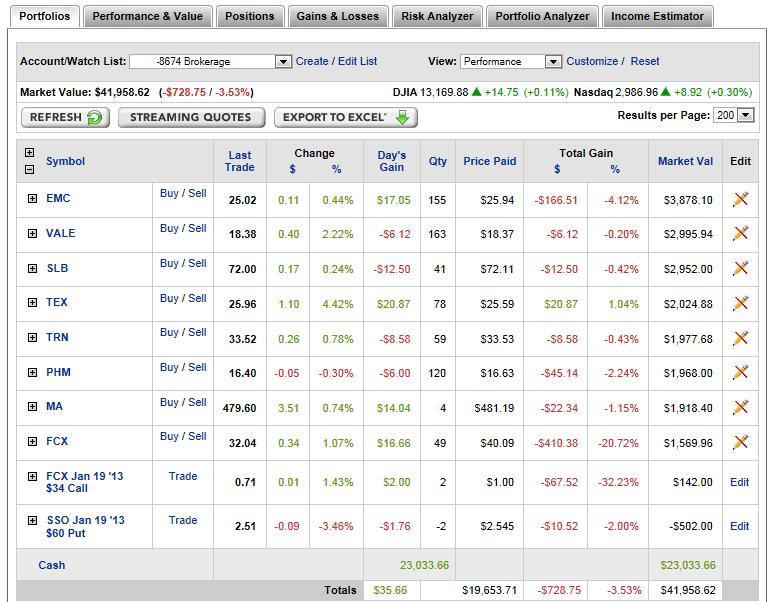
Sold out of stocks for gains and switched into new names that I believe have more upside from here. We also received $500 today for selling 2 puts on the S&P 500 (SSO- 2x S&P 500 ETF). It is a nice premium to get paid just to buy the stock. (I also believe the bottom has been put in on the S&P 500).


